📊 Results
Results keeps every test execution of every cycle, newest first, archived cycles included. Each row is one dated launch of a cycle. Expand a row to see its summary tiles and its runs. Open a run to see what was played, step by step, with the SAP status bar, the expected and actual values, the database proof and the screenshots. Anyone who has used a test-management tool will recognize the layout: a test execution groups the test runs of the cases it played.
All three roles can read Results. Admins and Testers use it to follow their runs. Auditors use it to review the evidence and export it: an Auditor reads everything and changes nothing.
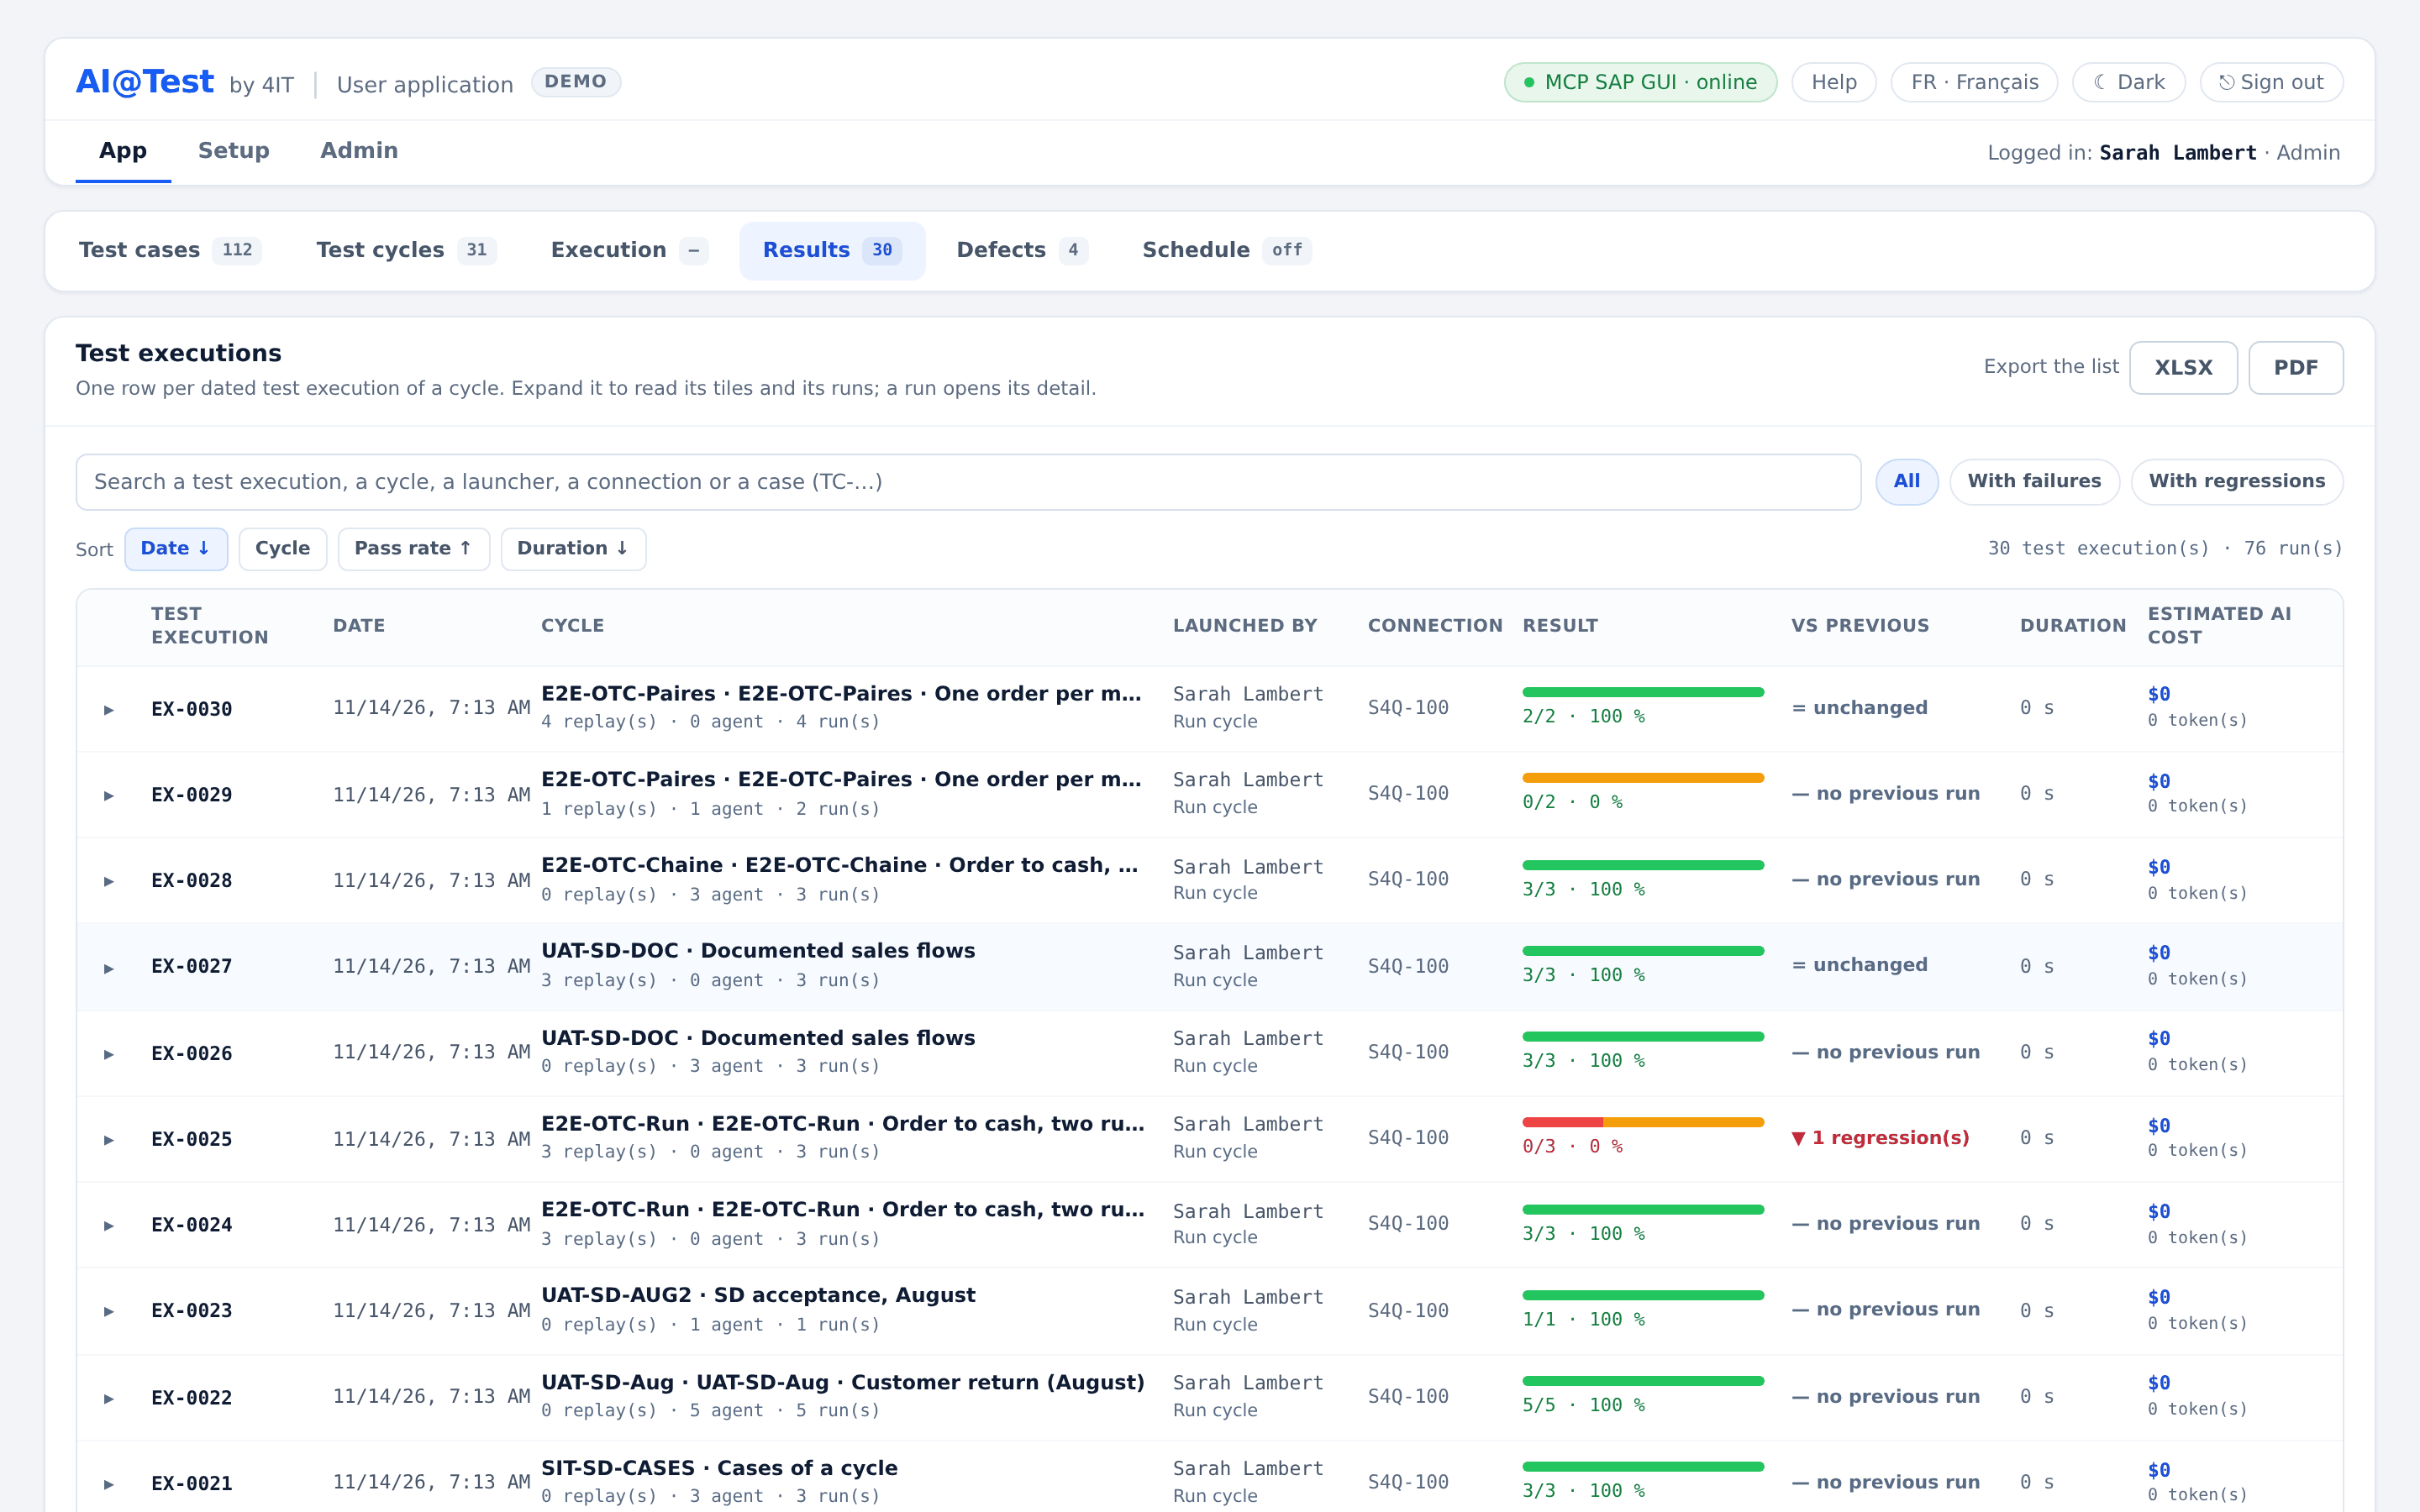
- Test execution: the dated launch of a cycle, numbered EX-…. It freezes its connection and its list of cases, and groups their runs.
- Test run (or simply run): one case played in a test execution, with its verdict, its log and its screenshots.
- Compilation (agent mode): the first run of a case, or its recompilation once its Gherkin has changed. The AI agent plays it in SAP and writes its trace.
- Replay (replay mode): a run that replays the trace of a compiled case with no AI and no tokens. It is free and its verdict is stable.
Open Results
Results is a sub-tab of App: click "Results". The screen lists the "Test executions". You can also get there from other screens:
- In Execution, double-click a case to open the detail of its last run.
- In the Test cases library, the "hist." link of a case ("History of TC-… in Results") opens Results narrowed to that case: "History of case TC-…, across all cycles".
- When Results is narrowed to one cycle, a line says "Test executions of cycle …".
To remove the narrowing, click "Show all test executions".
Find a test execution
- Search: type a test execution, a cycle, a launcher, a connection or a case identifier (TC-…) in "Search a test execution, a cycle, a launcher, a connection or a case (TC-…)".
- Filters: "All", "With failures", "With regressions".
- Sort: "Date ↓" (newest first), "Cycle", "Pass rate ↑", "Duration ↓".
- Counter: shows "N test execution(s) · N run(s)", or "N of M test execution(s) · N run(s)" when a search or filter is applied.
- Pages: "‹ Previous" and "Next ›".
Read the list
Each row is one test execution:
| Column | What it shows |
|---|---|
| Test execution | The EX-… identifier. A status follows it unless the test execution ended normally: "Running", "Stopped" or "Frozen (INFRA)". |
| Date | When the test execution started. |
| Cycle | The cycle, an "archived" mark if the cycle has been archived since, and the split of its runs by mode, such as "3 replay(s) · 1 agent · 4 run(s)". |
| Launched by | The user who started it, or the schedule, and the button that started it: "Run cycle", "Run case", "Re-run case", "Recompile case", "Retest", "Re-run failed cases" or "Schedule". |
| Connection | The SAP connection the runs reached. |
| Result | A bar of passed, failed and other runs, and the pass rate, such as "8/10 · 80 %". A test execution still going reads "… · running". An interrupted one reads "… · interrupted, out of the rates". |
| vs previous | Regressions and fixes compared with the previous runs (see below). |
| Duration | From start to close. |
| Estimated AI cost | The AI cost of the compilations in this test execution. Replays cost nothing. While a compilation is still running, the amount counts the finished runs only and reads "so far · compilation in progress": a compilation is priced at the end of its run. |
Expand a test execution
Click a row, or its arrow, to expand it. The expanded row shows:
- Six summary tiles (see the table below).
- The cost line, such as "Estimated AI cost: … · 1 agent run(s), 9 replay(s) without AI".
- "Re-run the failed cases" and "Export the test execution" (XLSX or PDF).
- "Test runs · N": one line per run, with "detail →" to open it.
- "Replays for the bar", when a case of a chained cycle was compiled: the cases before it in the Mapping chain, replayed without AI to feed its bar. They count neither for the cycle's state nor for their own case's results.
- "Excluded cases": cases listed in the test execution that got no run, each with its reason. For example: "removed from the cycle", "archived case", "tagged @non-jouable", "open Blocking point in the Consistency check", "the instance's LLM spending cap reached".
- "Interrupted: …": shown when the test execution did not end normally, with its cause, such as "lane time limit exceeded", "hub restart" or "stopped by …".
| Tile | What it counts |
|---|---|
| Cases | The test execution's frozen list of cases. |
| Passed | Probative, fully proven runs, recovered ones included. |
| Failed | Probative failures, with INFRA failures left out. |
| Blocked | Blocked runs, plus everything counted apart: non-probative runs, runs with partial proof, INFRA failures, excluded cases and runs still going. Its subtitle gives the breakdown. |
| Recovered steps | Steps where data was adapted under the allow list. |
| Duration | From start to close. |
The runs table has the columns "Case", "Title", "Status", "Mode" ("replay" or "agent"), "Steps", "Defect" (such as "DEF-004 · high", or "closed"), "Duration", "AI cost", "vs previous" and "Detail". A case with variables gets one run per data row it played. Its row is named "row 2/3 · data set v1 · …", or "baseline".
Verdicts and statuses
Status of a run
| Status | Meaning |
|---|---|
| Passed | The run played all its steps with no deviation. |
| Failed | At least one step failed: what SAP displayed, or what the database holds, contradicts what the trace expects. The failing step shows the Expected and the Actual values. |
| Blocked | The case could not be played to a verdict. Its cause is shown in place of the result. A blocked case is never a defect. |
| Running | The run is still going. Its steps appear as they are played. |
Marks next to a status
A status can carry marks. Each mark changes what the result proves and where it is counted:
| Mark | Meaning | How it is counted |
|---|---|---|
| "· INFRA" | The run failed on an infrastructure outage, not on an SAP deviation. | Counted apart under Blocked, never among the failed. No defect is created. |
| "Non-probative" | The result proves nothing about the case as it is now. Either its Gherkin changed since, or the run did not play the trace the compilation validated, or that trace has since been found faulty. The detail of the run gives the reason. | Keeps its status, shown greyed out. Counted under Blocked, never among the passed or the failed. |
| "Passed · x/y Then anchored" | A passed run in which some Thens are not anchored: they have weak proof, no proof, or are not attached to this Gherkin. The run detail names each Then held back. | Shown greyed out. Counted apart under Blocked, outside the passed runs and the pass rate. |
| "row not replayed by the bar" | A passed compilation whose own data row was never replayed by the bar: the trace writes to SAP, so the bar replayed two other rows. | The pass rests on the agent's compilation alone. It does not fix a defect and is not compared with the previous run. |
| "unverified proof" | The run belongs to a cycle with unverified proof: no database proof was played and only the screen judged. | Counts fully for defects. |
| "recovered" | The run passed after data was adapted under the allow list. The adaptation is shown at its step. | Passed. |
| "Played without the value of …" | The case receives a value from another case through the Mapping, but was played without that value, alone or in a test execution started without links. | Shows in Results, but the state of the case in its cycle does not count it: only a chained test execution proves the chain. |
A Then is anchored when the trace proves it by a reliable reading of SAP that proves it on its own, or that asserts the values the Then quotes: a message key, the value of a field, or a read of the database. For a Then that quotes no value, only a message key or a read of the database anchors it. A Then proved only by a less reliable clue, such as a text found on screen, has weak proof. "Passed" alone always means every Then is anchored.
Status of a test execution
| Status | Meaning |
|---|---|
| Running | The test execution is still going. |
| Done | It ended normally. |
| Stopped | It was stopped by a user, by the lane time limit, or by a hub restart. The cause is shown. |
| Frozen (INFRA) | It stopped on an infrastructure failure, the INFRA verdict, or on an SAP session that needs inspecting. No defect is created and nothing is charged to the cases. Cases not played read "not run — resume at the frozen case". A case held on an SAP session is re-run with "Re-run the held case". |
Status of a step
| Status | Meaning |
|---|---|
| Passed | The step played as the trace expects. |
| Recovered | Data was adapted under the allow list (dates, document numbers), then the step was replayed. The run stays Passed. |
| Failed | A check of the step was contradicted. |
| Blocked | The step could not be played. Its cause is shown in place of its result. |
A cycle frozen on an INFRA verdict says nothing about the cases: the infrastructure failed. Re-run the case once the service is back. If the failure lasts, report it to support with the reference of the run.
Compare with the previous run
The "vs previous" column compares each run with the last run of the same case, in the same cycle, on an identical Gherkin. For a case with variables, the comparison is made row by row.
| Value | Meaning |
|---|---|
| ▼ regression | Passed before, failed now. |
| ▲ fixed | Failed before, passed now. |
| = unchanged | Same outcome as before. |
| — no previous run | No comparable run before this one. |
An interrupted test execution is not compared. Use the "With regressions" filter to list only test executions that contain at least one regression.
The detail of a run
To open the detail of a run:
- click "detail →" on its line in an expanded test execution;
- double-click the case in Execution, which opens its last run;
- click "Open the run" on a defect.
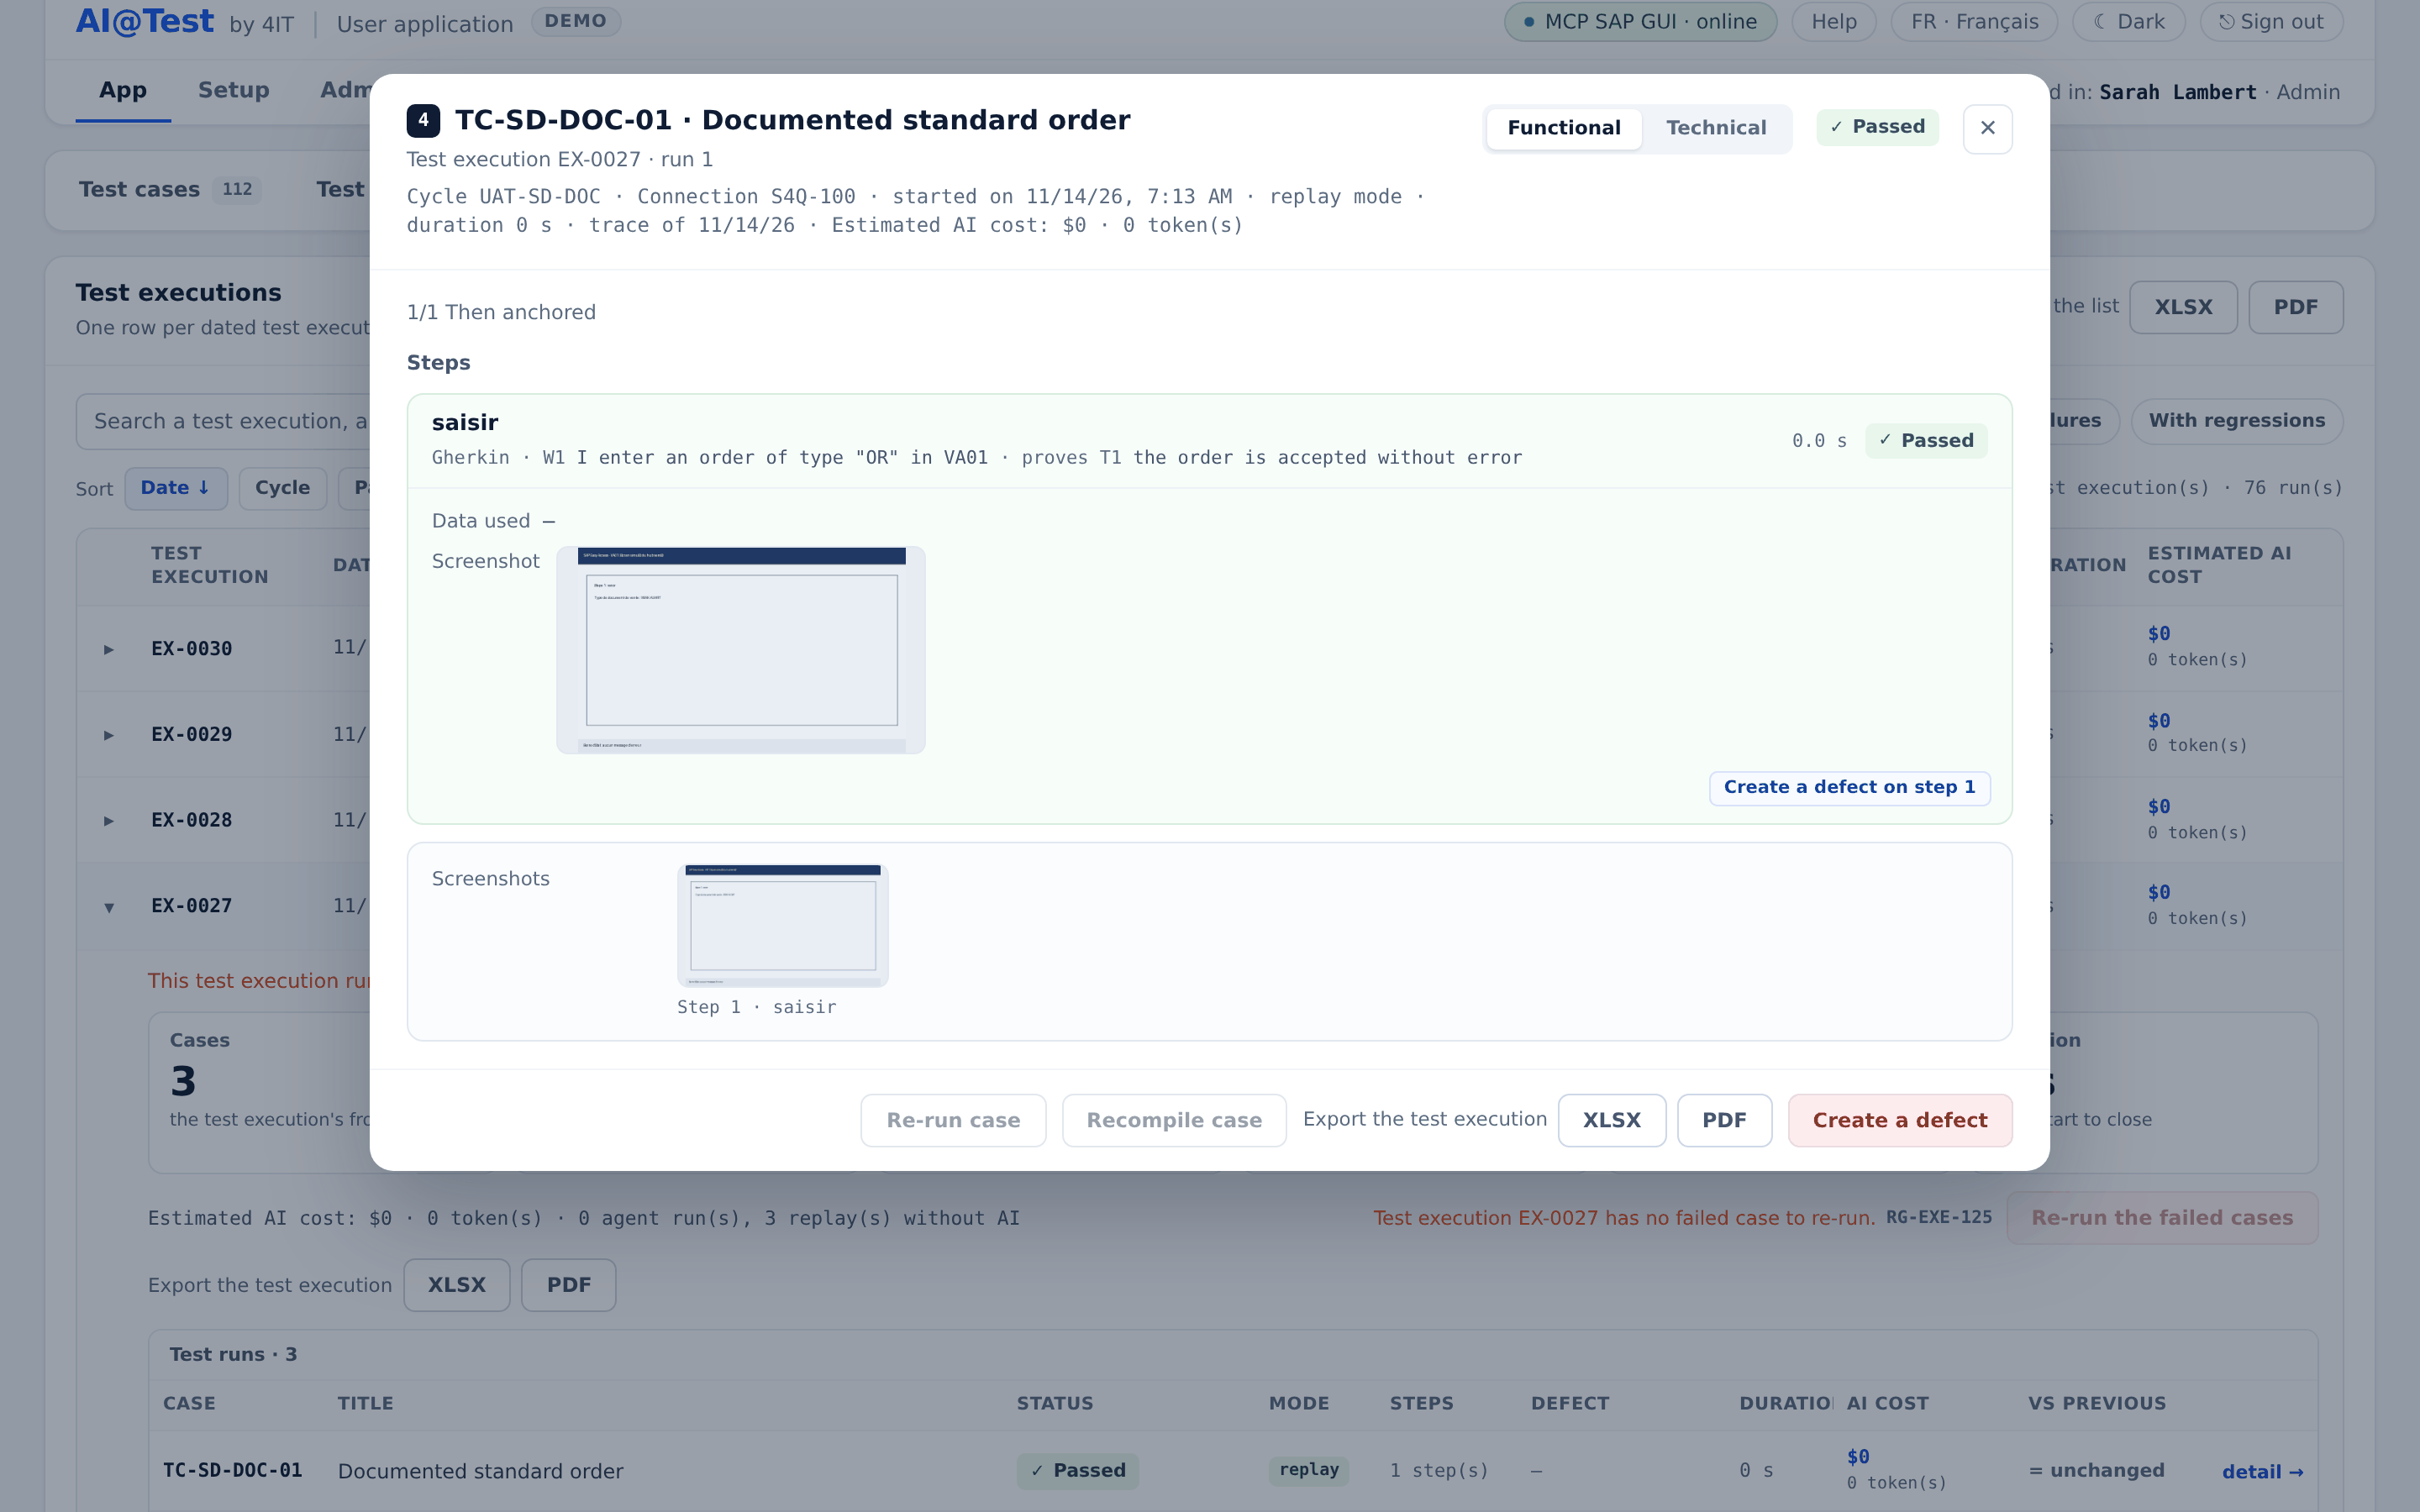
The header
- The title: "Run detail — TC-…", followed by the case title.
- The position: "Test execution EX-… · run N", plus the data row for a case with variables.
- The meta line: "Cycle … · Connection … · started on … · replay mode" (or "agent mode") "· duration … · trace of …", then the estimated AI cost.
- The status, with its marks ("· INFRA", "· row not replayed by the bar", "· unverified proof").
- "Detail view": "Functional" shows the screenshot under each step. "Technical" shows the technical lines of each step: the calls the engine made to the SAP GUI driver, the windows it answered, and optional steps that were skipped.
Above the steps
Depending on the run, notes appear before the steps:
- "This run is still going: its steps arrive as they come."
- "Non-probative —" followed by the reason, such as "the Gherkin changed since this result".
- "This case is held by the freeze …", with how to re-run it.
- "Incomplete visual proof — N/M screenshots arrived."
- "Recovered: passed after data adapted under the allow list, shown at its step."
- "Received from upstream": the values this case received from a case played before it through the Mapping, each with the run it came from.
- The Then count, such as "2/3 Then anchored — weak proof: …".
When a compilation did not succeed, the detail starts with "What to do". The cause sits underneath, folded under "Detail for support":
| What to do | When |
|---|---|
| Correct the case, then re-run it | "The case itself prevents its compilation: correct its Gherkin, its test data or the Blocking point the detail names, then re-run it." |
| Re-run the case | "The AI agent did not succeed this time": re-run it, which is a new compilation with its AI cost. If the same reason comes back, contact support. |
| Contact support | "Neither the case nor a re-run can fix this": contact support with the reference of the run. |
A user who cannot launch runs reads "Report it to a Tester, who can correct and re-run the case."
The step tiles
Under "Steps", each step of the trace is a tile:
- Header: the step label; "Gherkin ·" followed by the Gherkin lines the step covers and the Thens it proves, each marked "proves", "proves (weak proof)" or "unproven"; the step duration; the step status.
- "Data used": each variable the step cited, as
name=value, with the value of the played row for a case with variables. - "Data modified": for a recovered step, each adapted field as "field: before → after", with the allow-list rule applied.
- "Status bar": the message SAP displayed at the failure, from the status bar or a popup.
- "Expected" and "Actual": what the failed check expected and what the engine read (see below).
- "Result", "Failure" or "Cause": the result of a passed step, the engine's message for a failed step, or the reason for a blocked step.
- "Defect DEF-…": shown when a defect is attached to the step.
- The screenshot of the step in the Functional view, or its technical lines in the Technical view.
- "Create a defect on step N": shown when the step has no defect yet.
Expected and Actual
When a check fails, the step shows the raw value expected and the value the engine actually read, so you can judge the gap without opening SAP:
| The check was about | Expected looks like | Actual looks like |
|---|---|---|
| A field value | "“1000” in field …" | The value read, "(blank)", or "field not on screen" |
| A message | "message “…”", "a message of type …", "no message of type E or A", "a message of class …" | The message read, or "nothing read" |
| A text on screen | "the text “…” on screen" | "not on screen" |
| Opening a transaction | "transaction opened" | "not authorized", "transaction not found", "transaction locked", "blocked by a popup", "landed on another screen" |
| The kind of screen | "entry form", "list", "detail", "modal popup"… | Includes "runtime error (dump)" |
| The database | "Database proof · at least 1 row in …" or "exactly 1 row in …" | "1 row found", "no row found" |
Screenshots as evidence
Screenshots are the visual evidence of a run:
- In the Functional view, each step shows its screenshot. The "Screenshots" strip of the detail lists every screenshot of the run, in both views. Click one to open the viewer, which has "← Previous", "Next →" and "Open in a new tab".
- "Record the run (a screenshot at each step)" is ticked by default. Untick it when you launch a replay and only the screen of a failure is captured. The option appears in Execution, in the confirmation of a re-run, a retest or a re-run of the failed cases, and on a schedule.
- When the run is recorded, a compilation that succeeds keeps a screenshot of each step, taken during one of the two replays without AI that validate it. When the bar did not replay the run's own data row, the detail warns that these screenshots show another row's data.
- Screenshots can be read once the run ends. While the run is going, the Execution log shows them.
Database proof
A success message on screen does not prove that SAP saved anything. That is why a trace that creates data must carry a database proof: a read of the SAP tables that shows the record really exists. Outside a cycle with unverified proof, a trace that creates data without one never passes the bar of its compilation: "The trace creates data without a database postcondition: a success message does not prove persistence."
In the run detail, the database proof is a step of its own, labeled "Database proof ·" followed by the channel it read through: an SQL read through ADT, or a table read in SAP GUI. When it fails, Expected says how many rows were required ("at least 1 row in …") and Actual says how many were found.
A cycle can be set to "Unverified proof: Yes — only the screen judges". Its runs play no database proof: a trace that writes to SAP must then prove its success on screen, by the key of the status bar message. Each run carries the "unverified proof" mark, and the runs still count fully for defects.
Re-run from Results
| Action | Where | What it does |
|---|---|---|
| "Re-run the failed cases" | Expanded test execution | "A single new test execution replays, without recompiling, the failed and blocked cases of this test execution." It never adapts data. |
| "Re-run case" | Run detail | "The case runs again on its own in cycle … of this run." A compiled case replays at no cost. |
| "Recompile case" | Run detail | "The AI agent recompiles the case in cycle … of this run: this costs." |
| "Re-run the held case" | Run detail of a case held by a freeze | Runs the held case again on its own, on its current connection. When the case receives a value through the Mapping that its run did not record, "Re-run the held case on its baseline" replays its baseline row instead, without the value received from its upstream cases, once you agree to it. |
| "Create a defect" | Run detail | Opens a defect by hand on this run (see Defects). |
Each re-run asks for confirmation first and becomes a new test execution at the top of the list. "Re-run case", "Recompile case" and "Re-run the held case" from the run detail also carry the Execution option "Allow AI Agent to adapt test data in case of issues"; "Re-run the failed cases" and "Retest" never adapt data.
Export
| Export | Where | Formats | Content |
|---|---|---|---|
| "Export the list" | Header of Results | XLSX, PDF | The filtered list: Test execution, Date, Cycle, Started by, Connection, Result, vs previous, Duration, AI cost, with the scope and selection applied. |
| "Export the test execution" | Expanded test execution, or the run detail | XLSX, PDF | The header of the test execution, the six tiles, the cost line, every run (Case, Row, Status, Mode, Steps, Defect, Start, Duration, Cause, Received from upstream), the excluded cases with their reason, and the defects. |
Run statuses keep their marks in the exports, such as "Passed (1/2 Then anchored)", "(non-probative)" or "(INFRA)". The PDF cuts very long texts and says so; the XLSX keeps them in full. Each export is recorded in the audit trail.
Who can do what
| Action | Admin | Tester | Auditor |
|---|---|---|---|
| Read Results and the detail of a run | Yes | Yes | Yes |
| Export the list or a test execution | Yes | Yes | Yes |
| Re-run, recompile, re-run the held case | Yes | Yes | No |
| Create a defect | Yes | Yes | No |